Day 5: Solve without equations (AP C)

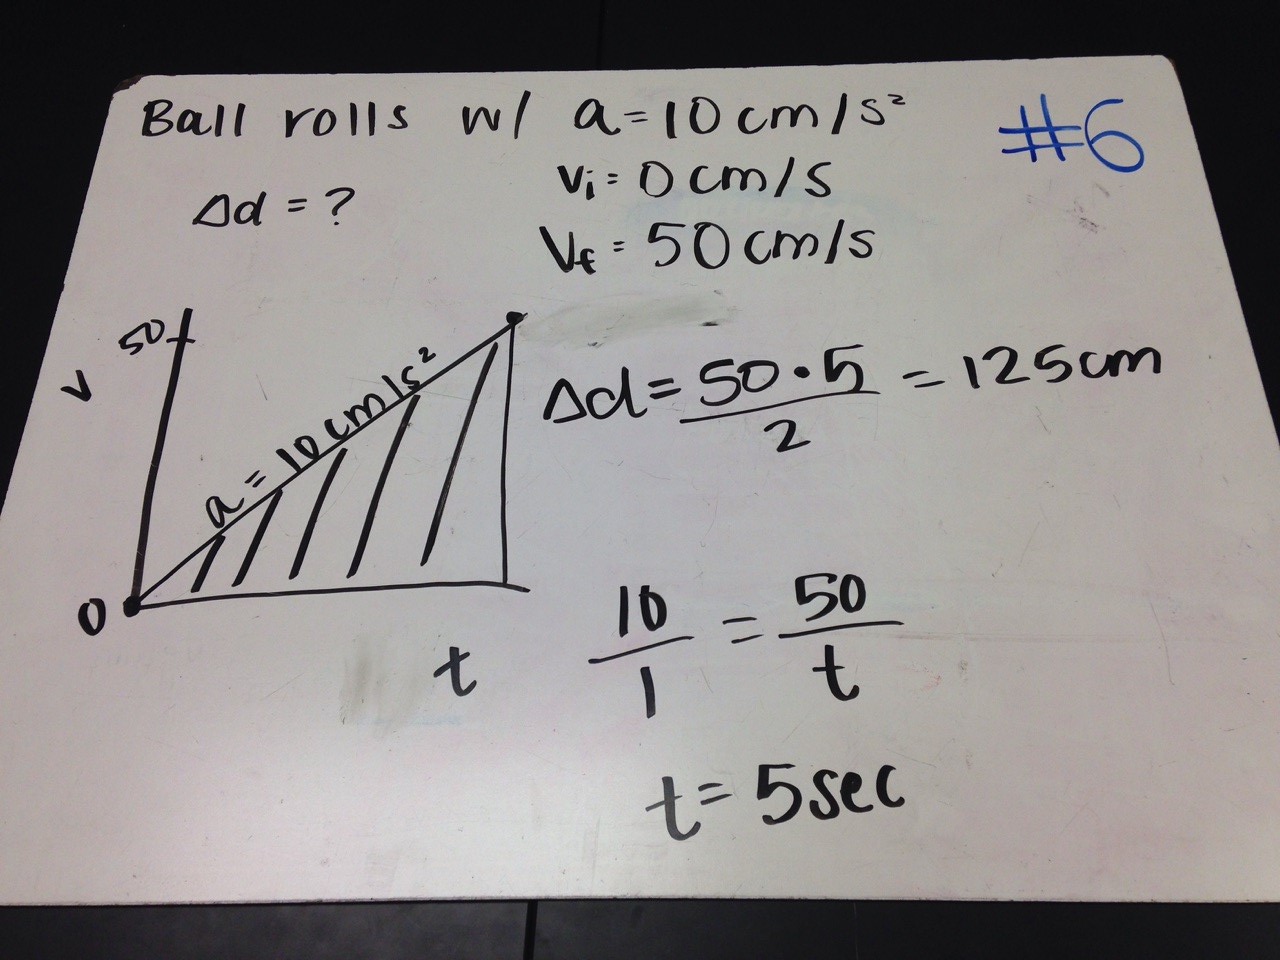
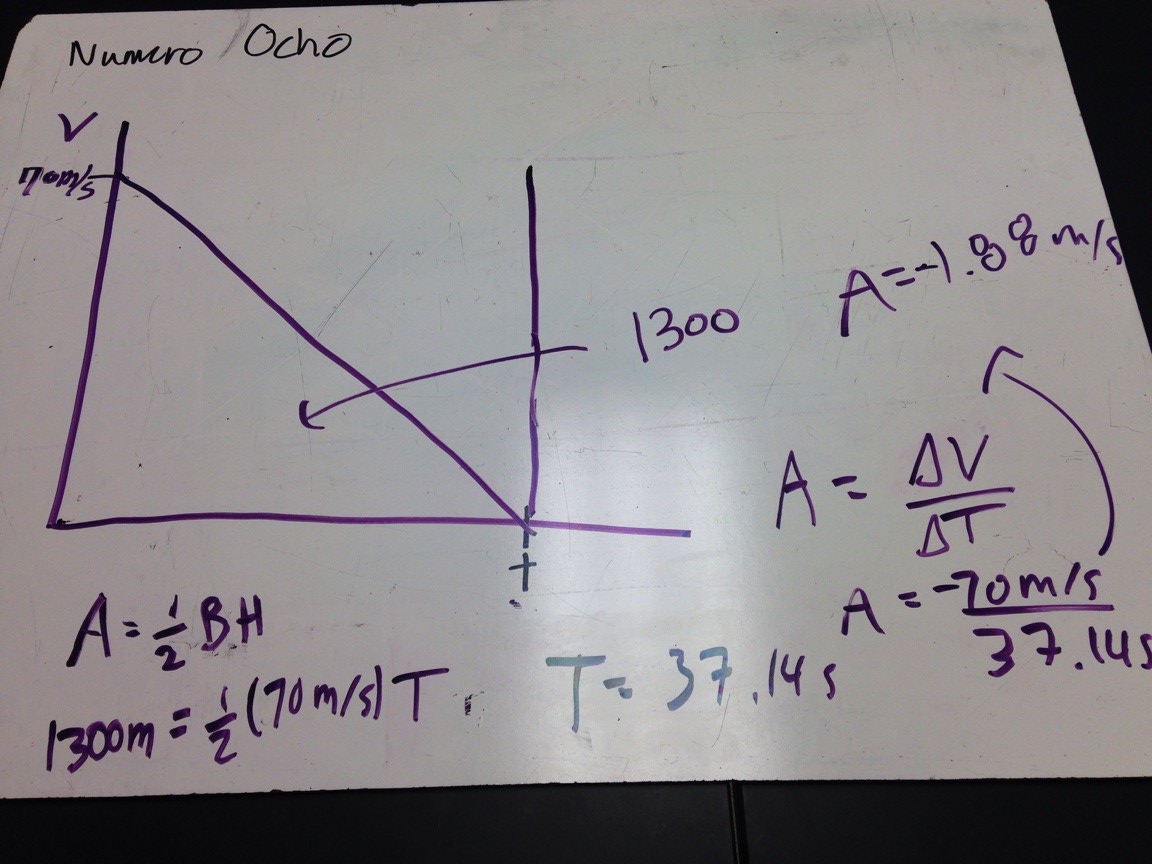
Last night’s homework involved the challenge to solve a set of constant acceleration word problems without using the kinematics equations. Instead, the instructions were to sketch a velocity vs. time graph for each problem and then use that velocity vs. time graph to solve the word problem. I first hear this idea from Anne Goshorn, who uses this as the main method for students to solve kinematics problems in her 1st year physics classes. My goal is to broaden each student’s skill set so that they have multiple tools that they can use to attack a new problem.

Since the majority of my students are taking Calculus concurrently with AP Physics C, I try to make sure that I wait to have students use differential and integral calculus until they have learned it in their calculus class. However, slope (rate of change) and area under the curve (accumulation of change) can be understood and applied graphically, without needing to know the rules for differentiating and integrating polynomials and other functions.

Day 5: Buggy Challenge Lab (1yP)

Our last day of the Constant Velocity Unit included our first Challenge Lab in 1st year physics! This particular challenge lab has been well documented elsewhere. Here’s a little of how we did it today, including a trick I learned for making sure the cars actually hit.

I use the following format to encourage/require teams to work together to solve the challenge. Splitting up the work into these different sub-sections encourages students to follow a process when solving complex problems, and also provides structure for making sure that everyone gets to play a part in the process.

Interestingly enough, the most common successful method of solving this was by using a graph. The idea of an intersection point is just so much clearer once they start creating a graph. Many students struggled solving this with algebra as a first approach, but were able to understand and figure out how to set up and solve a system of equations once they realized how the equations correlate with what is going on in their graphs.

Day 4: 5-Minute POGIL (1yP and AP C)

Last year I started using a strategy of creating (or using) short POGIL-like activities when I introduce new operational definitions that I would like students to practice. In 1st year physics today, it was about distance vs. displacement, and in AP Physics C it was about determining distance by determining the area under a velocity vs. time graph. To break this up, I had students stand up, hand up, pair up with someone not at their current group, get one worksheet to share with their partner, and then practice applying the definitions on the handout together. When a pair finishes, they check their answers and thinking with another group, and then return back to their normal seats. Here’s an example of a 5-minute activity from today.

The best part of this format is how engaged students were. I think that the movement and working with a partner of their choice on a clearly defined task, worked well.

Day 3: HW Discussion Format (1yP & AP C)

I used the following discussion format in my 1st year Physics classes today to have students discuss their responses to homework. It was great! Students were first paired randomly with other students. Then, I explained the following process for them to follow to choose specific questions or problems from the previous homework assignment. This was a mixture of conceptual questions and “translating” between different representations of motion.

This went better than any of my attempts to get students to “discuss last night’s homework” from last year. As I walked around checking homework, I heard lots of discussion like “I think ____, because…” or “why did you say that?” I think the diversity of the types of questions on this particular assignment, and uncertainty that students felt with their responses, lent to this working well. I have done this twice already in AP Physics C as well. I would say it has gone well in that class, but not as well as the 1st year students did with it today.

Day 3: Whiteboarding Mistakes Game (AP C)

We did the Whiteboarding Mistakes Game today. The EQ today was “does negative acceleration always mean slowing down?” and the goal of the worksheet was to start with our operational definitions of velocity and acceleration (v is slope of x vs. t graph, a is slope of v vs. t graph) to develop new rules about how the directions of v and a must compare if an object is either speeding up or slowing down. Students were generally pretty excited about intentionally planting one mistake on their whiteboard, but it was also harder than I had anticipated for team to come up with a “good” mistake. (I got some good laughs when I used Kelly O’Shea’s line about making as many unintentional mistakes as they would like.) We didn’t finish the discussion today. I am interested to see how well we are able to focus on the theme of the worksheet while also doing the “mistakes” part of it.

Day 2: High-Low Track (AP C)

The challenge lab in day 1 ended up being an example of a “High-Low Track.” I didn’t plan this, but the conduit that I used for the long track bent under its own weight, causing it to be steeper at the beginning and less steep at the end. A team that used the iPhone Compass App to measure angle found that the angle ranged from 6 degrees at the beginning to 2 degrees at the end. Even with this, students were able to determine the time relatively accurately (many groups within 10%). The Challenge Lab HW from day 1 asked students to write about assumptions they made when solving the problem, which lead to a discussion of the angle.

Today, I asked students to predict how this bow in the track would affect the time it would take to reach the end. My wife had the idea of using the hot-wheel track anchors to create these high-low tracks in my classroom. Here’s what it looked like:

Both tracks have the same total horizontal and vertical displacement. The bottom track is slightly longer than the top. Question #1 was “Which Hot Wheel car will reach the bottom first (if either)?” This lead to a great discussion, I wish I had taken pictures of the graphs that students drew to explain their reasoning. Most thought it would be a tie. Question #2 was “How will their speed at the bottom compare?” Most students correctly predicted the answer to the second question. We used the BeeSpi photogates and hot wheel anchors with photogate mount (my design) to measure the speeds. An average of 2.05 seconds for the top track, and 2.03 for the bottom.

Day 2b: Card Sort to find your seat! (1yP)

On day 2 of first year physics, students were greeted at the door with a handshake, a smile, and were given a card and instructions that “this will help you find your seat.” The instructions on the board directed students to look at their card and then interact with the other students in the class to find others with cards that describe the same motion. These cards would help them find their group for the day. Once they find their group, they can choose a table to sit at and then introduce themselves. We did this after students had a whiteboard discussion comparing graphs, equations, and written descriptions of constant velocity motion, but before they were introduced to Motion Maps (pictorial representations).

This idea was influenced by a blog post by Marta R. Stoeckel about Building a Whole Class Culture, who was similarly influenced by Kelly O’Shea. The rationale that I explained to students went like this: “There are two main reasons we did this today. The first is that I want you to develop a comfort working with every student in this class. Working with a partner, team, and participating in whole class discussions will be a frequent experience in this class. Early in the school year I want you to get a chance to meet and interact with everyone in this class. We will be changing seats regularly the first couple weeks. The second reason we did this is to practice figuring stuff out. You were introduced to equations, graphs, and written descriptions of motion on day 1, but were not shown any diagrams. And yet, many of you were successful in figuring out how these representations related to each other and what the diagrams told you.”

This idea was also inspired by Brian Frank. I used his Card Stacks ideas as a model (and actually used them instead in my AP C classes). I decided to create my own so that there would be enough for classes as large as 32. Here’s a pdf of my card stack. I’m happy to share the original Word Doc, just contact me!

Day 2: What does this slope mean? (1yP)

The following whiteboards were created on day 1 of class, as part of the Tumble Buggy Lab. Each team was given instructions with a different starting point and direction of travel. In addition, half of the groups had fast cars (with speeds of about 0.3 to 0.4 m/s) and half slow (speeds of about .15 to 0.2 m/s). One group graphed Time vs. Distance and got a slope of 2.7. We will start day two off with the question “Which car (red or blue) did this group use? How can you tell?” The discussion we had with this was great. After a few follow up questions (“No, they didn’t calculate the slope wrong, No, they didn’t collect the data wrong”), I gave each group time to discuss it together. In each class, when we shared their solutions, there were at least 3 distinct ways of figuring this out, many of which I had not thought of.

Day 1: Tumble Buggy Lab (1yP)

My 1st year physics classes start off the year with a lab on day 1. Students will collect data to describe the motion of these “Tumble Buggies” with graphs, equations, and words. This is the paradigm lab for the constant velocity unit in the Modeling Mechanics curriculum. Each group will have different instructions. Students will look for similarities and differences in their graphs, equations, and descriptions.

Here are some examples of the whiteboards that students created to share their results. This year, I decided to let students roll with their instincts to write the equations without units or symbols that suggest the variables from their graphs so that we could fit this into one day. The discussion was a quick one (10 minutes to talk, 3-4 minutes to write after the discussion). I love that students experienced a full length lab experience on day 1.