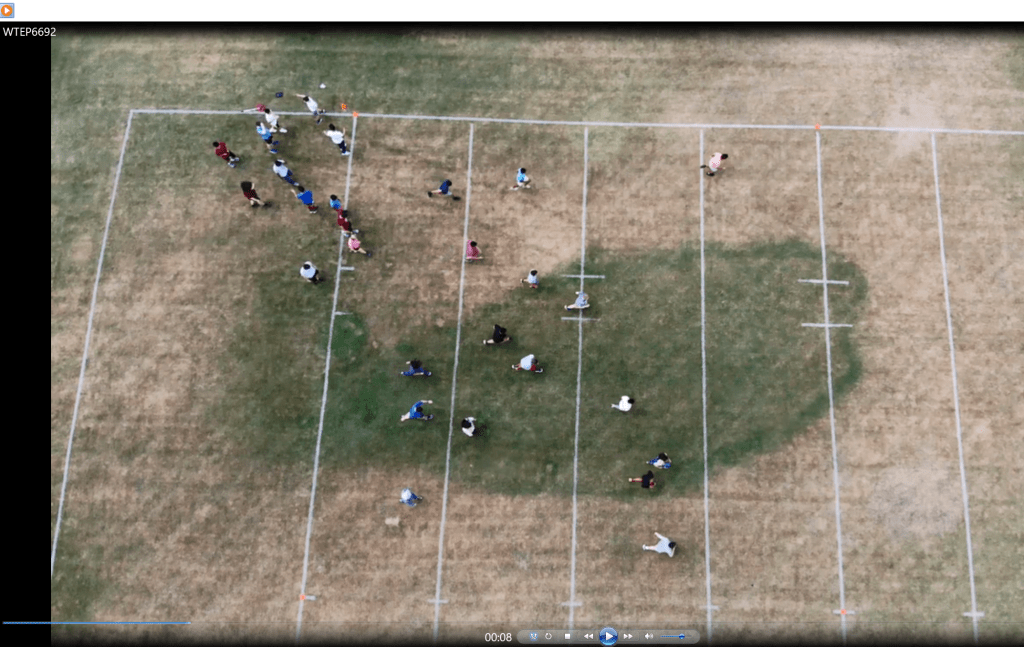
Students in AP C are learning how to linearize data today. We also used a drone to create a top-view video of footage of students running and/or walking on a soccer field with the instructions to “accelerate as constantly as you can over the 20 yard distance.” In today’s lesson, students are following instructions in screencasts that I created to learn how to use LoggerPro or Excel/Sheets to linearize data. Next lesson, students will be doing Video Analysis on this video, and then generating linearized graphs of x vs. t, v vs. t, and v vs. x for the drone video.